Displaying KPI Dashboards and Real-Time Statistics
Written By Ed Kinne
Last updated 10 months ago
Displaying internal KPIs and metrics on employee-facing displays is crucial for many organizations. This article reviews the two main ways that your organization can visualize data in Korbyt.
Displaying an Existing Web-Based Dashboard
Utilizing existing dashboards from tools like Power BI, Tableau, and other web-based platforms
Custom Designed Layout and Direct Data Integration
Leverage Korbyt’s integration engine to extract and visualize data in a custom-built dashboard
Displaying an Existing Web-Based Dashboard
Korbyt provides several ways to display dynamic live information directly from your existing web-based dashboard system.
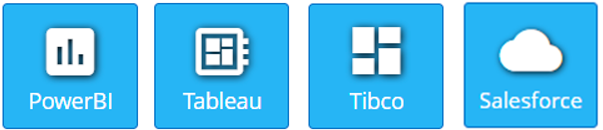
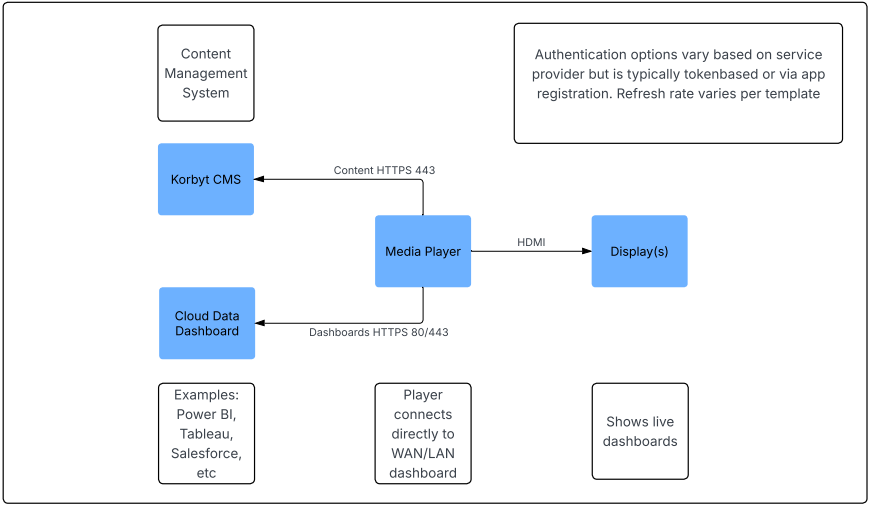
Using Power BI, Tableau, Tibco Spotfire, or Salesforce dedicated elements
Power BI, Tableau, Tibco Spotfire, and Salesforce are business intelligence tools that enable interactive data visualization through dashboards, with Power BI offering seamless Microsoft integration, Tableau providing advanced customization, Tibco Spotfire excelling in real-time data analysis and predictive analytics, and Salesforce offering real-time dashboards.
The Korbyt Layout Builder has native elements available that build a direct and easy connection to your existing dashboards and data.
Each element has unique values that are filled in to connect to your specific instance. For more details on each, please see their specific instruction articles.
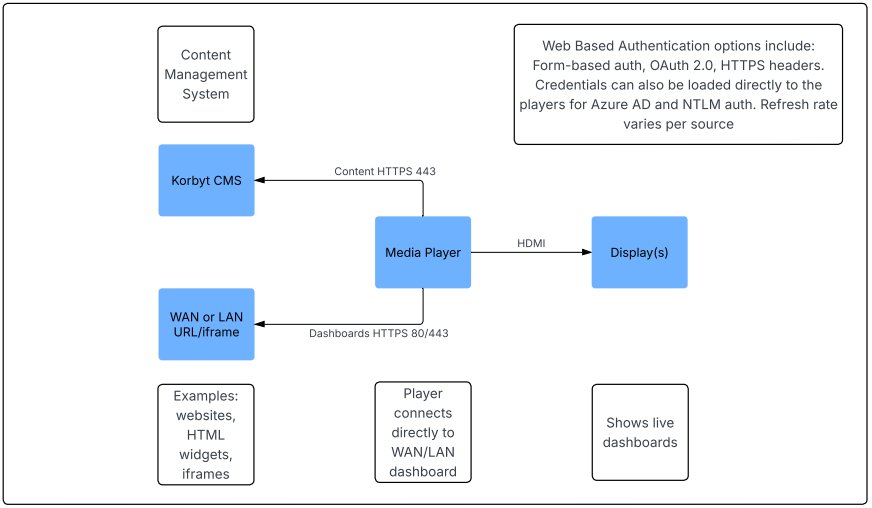
Embedding Other Web-Based Dashboards with a URL or HTML element
If your dashboard application supports embedding in third-party web applications, you can use the External URL or HTML Container elements in Korbyt.
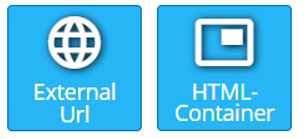
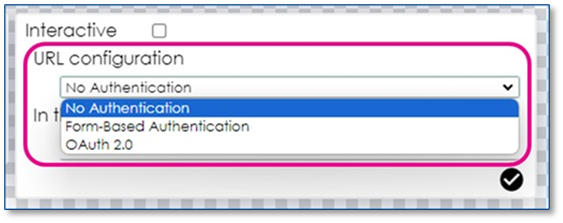
External URL
The External URL element allows you to reference a web address inside a Layout in Korbyt. If that Website requires it, the element can be configured for either Form-Based or OAuth 2.0 authentication.
SeeHow To Use An External URL Element for more details.
Embedding HTML Code
The HTML Container element allows you to embed HTML code provided by your dashboard and data service. Our element can use HTML Headers if required for authentication (such as tokens, API keys, or session cookies)
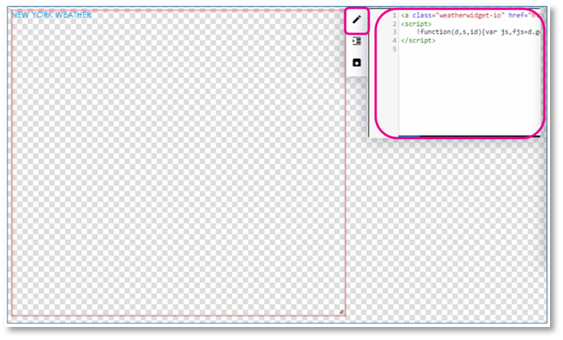
See How To Use an HTML Container Element for more details
Notes on Embedding:
Some dashboards may have security settings (e.g., X-Frame-Options) that prevent embedding in third-party applications. In such cases, adjustments may be needed from your IT team or the dashboard provider to allow embedding within Korbyt.
If your organization uses Windows-based dashboards and deploys Windows devices for digital signage, Korbyt can store Windows credentials on the device. This allows for seamless authentication when accessing the dashboard.
NTLM can also be used in Windows environments to verify user credentials without transmitting passwords, allowing authentication to an internal dashboard by validating the user's hashed credentials against an Active Directory or local security database
Custom Designed Layout and Direct Data Integration
If your organization's data is stored in a service that does not allow a path to publish to an external URL or one of our dedicated applications, Korbyt’s integration engine allows for seamless data extraction and custom visualization.
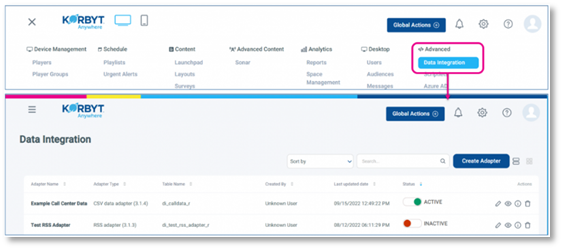
Integrating Your Data To Korbyt
Korbyt data adapters will extract and store data from systems that provide either API access (Rest, SOAP, etc) or that offer Export Capabilities (CSV, XML, JSON)
We provide adapter templates for the most common data systems
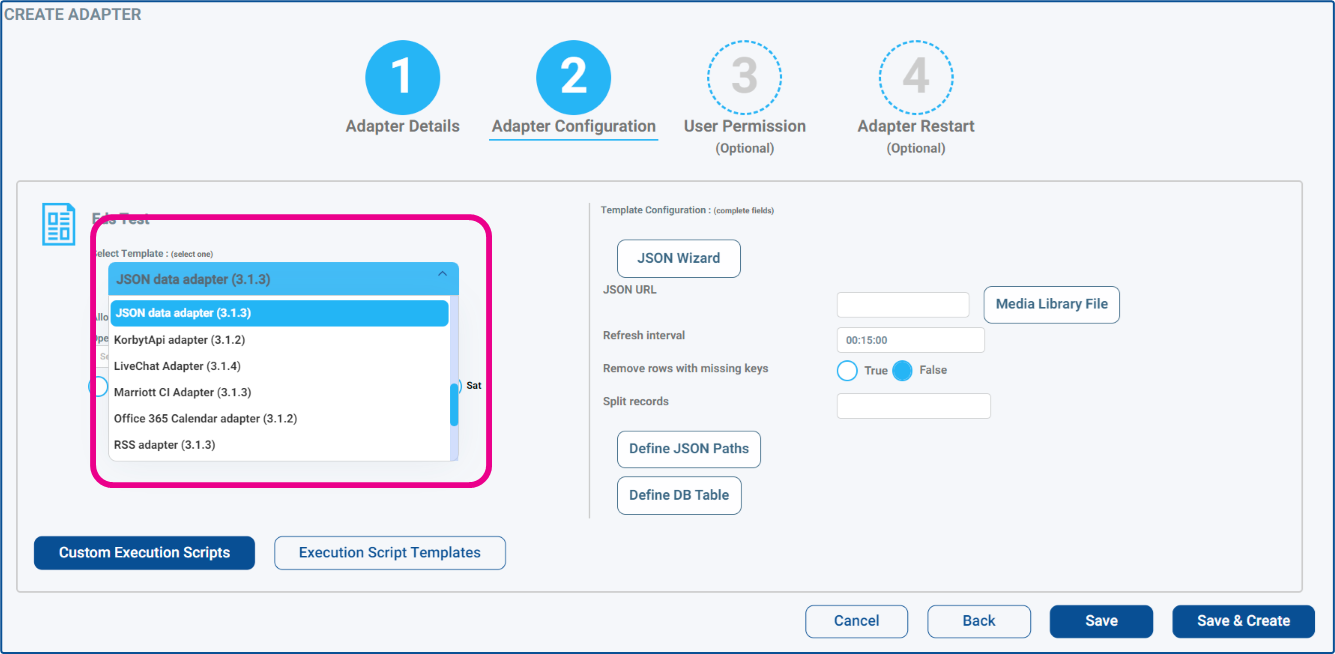
If we do not have a template for your adapter, we can create a custom adapter
See Data Integration and Data Adapters for more details on how Korbyt creates data connections
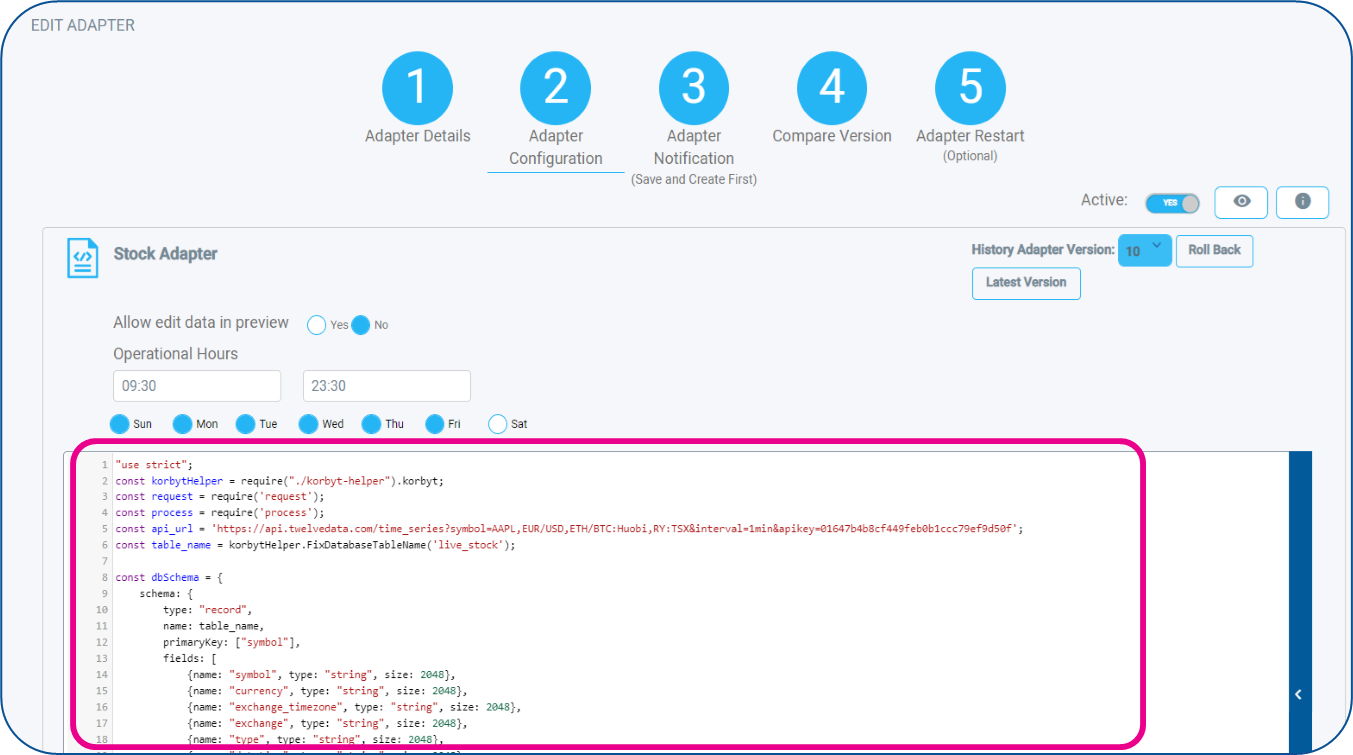
Visualizing Your Data in a Layout Design
Once retrieved, Korbyt’s Layout Editor allows you to:
Map fields and define data points and information format masking
Style your information in text, tickers, and gauges
Apply advanced filtering to show location-specific data based on the player
Add dynamic triggers that hide or show messages based on critical stats
For more details on how Korbyt can visualize your data, see:
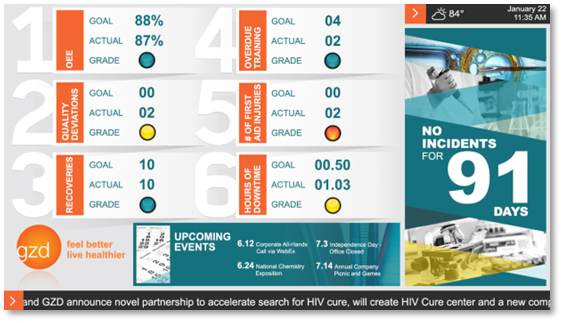
With Korbyt, organizations can display critical metrics in real time, ensuring employees have access to the most relevant and actionable insights.
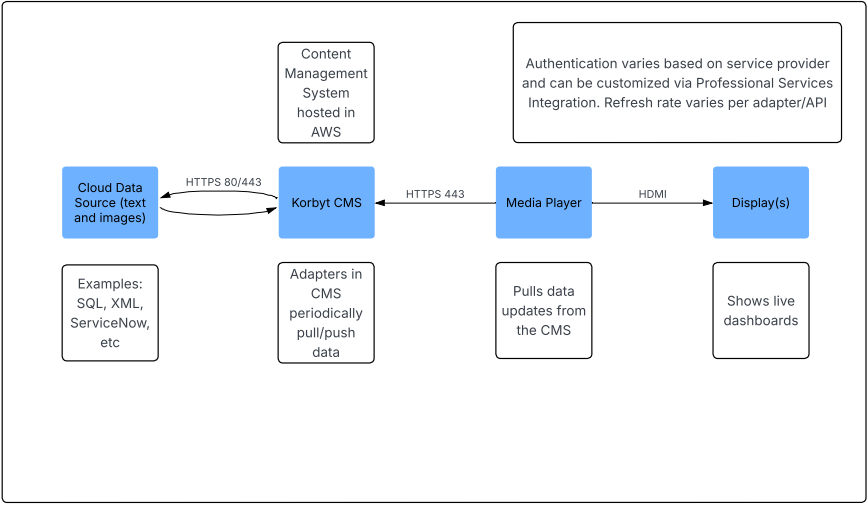
Data Integration Diagrams
The following diagrams illustrate the flow and connections involved in different paths to viewing data and dashboards.
Korbyt URL & HTML Embedded Dashboards
Korbyt Data Dashboard Template Elements
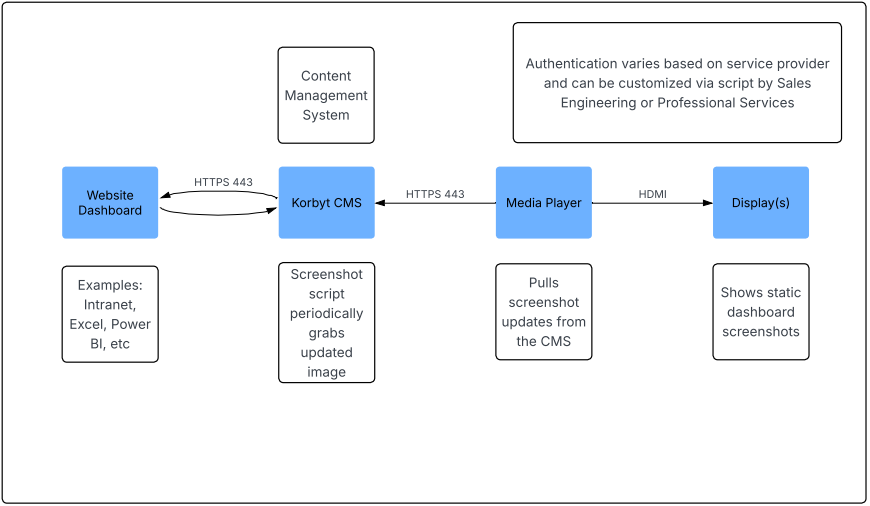
Korbyt Capture Automated Screenshot Tool
Korbyt Cloud Data Adapters