How To Use an OnTarget Element
OnTarget shows weather, news, social media, and other curated information in graphical and ticker-based display feeds.
Written By Ed Kinne
Last updated 12 months ago
NOTE: OnTarget is an additional paid service that you will need to discuss with your Client Relationship Manager, if you do not already have it purchased.
The Options available in the element, or “feeds” will be based on what which OnTarget Pakcage you subscribe to.
Feed options can be explored at https://korbyt.contentmenu.net/
Contact your Korbyt Sales Reprasentative or Korbyt Support if you wish to discuss adding new OnTarget feeds.
Weather Information through OnTarget
The location for the Weather information is based on the address information that has been set for the player, enabling specific weather information for each unique location without having to build multiple layout Designs.
For setting the address information on a player, see Controlling and Configuring Media Players in the CMS
Adding OnTarget Graphic Info
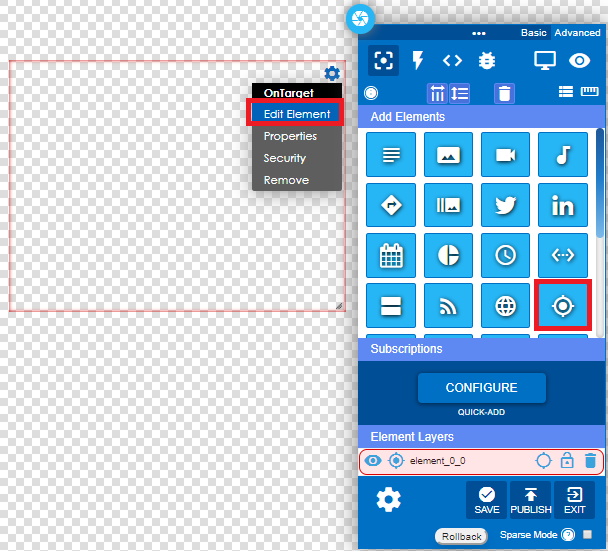
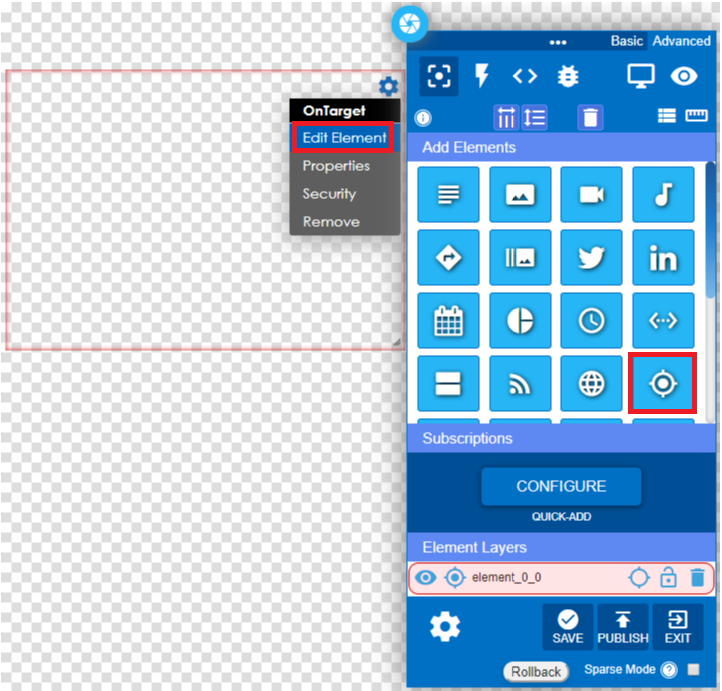
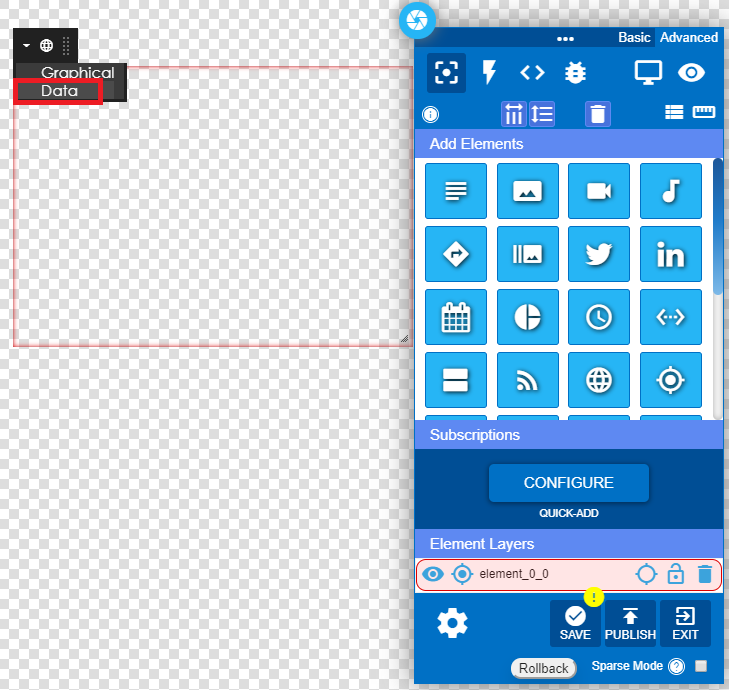
1 – Click and drag the OnTarget Icon into the layout area and edit the element.
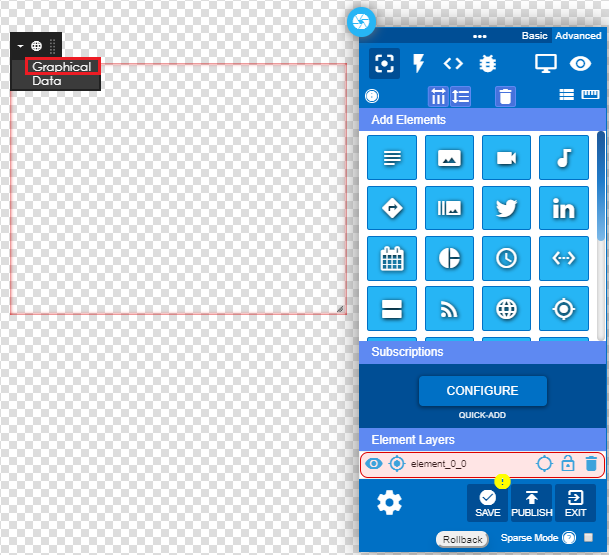
2 – Click on the drop-down arrow and select the Graphical option.
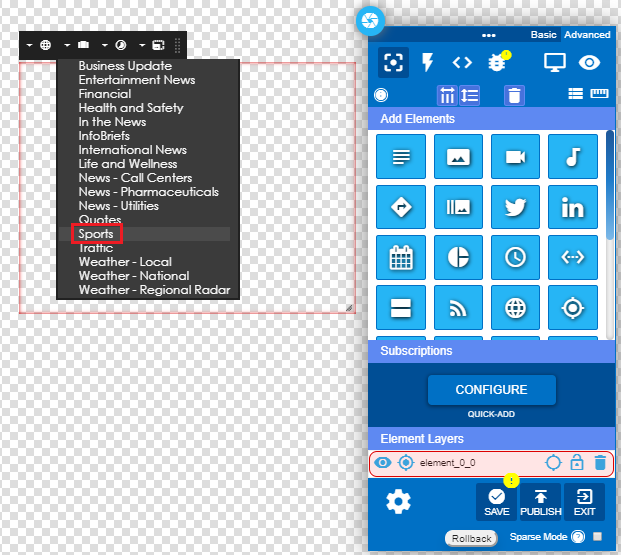
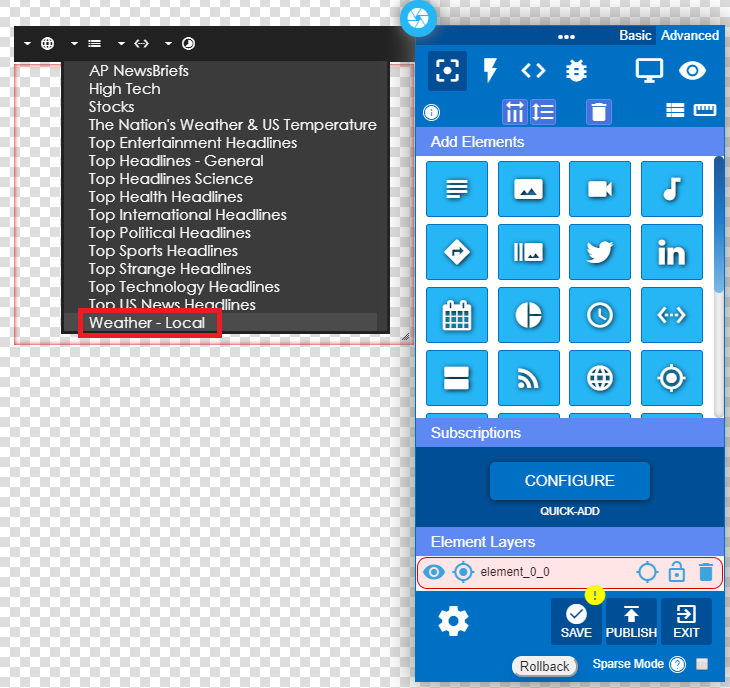
3 – Select the type of OnTarget content to display.
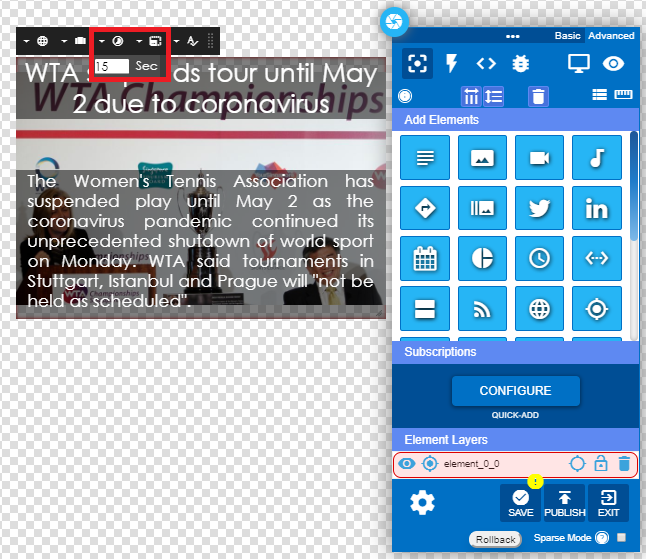
If the OnTarget graphic is successfully imported into the layout, it will immediately display.
4– Select the Seconds per slide.
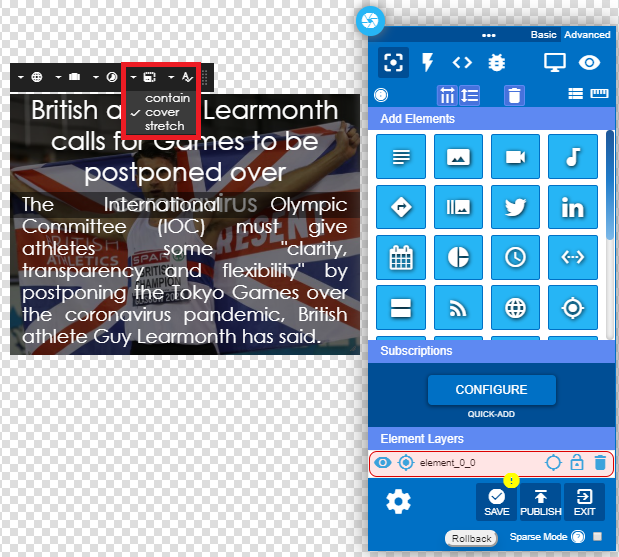
5 – Select the Image Fit for the element area.
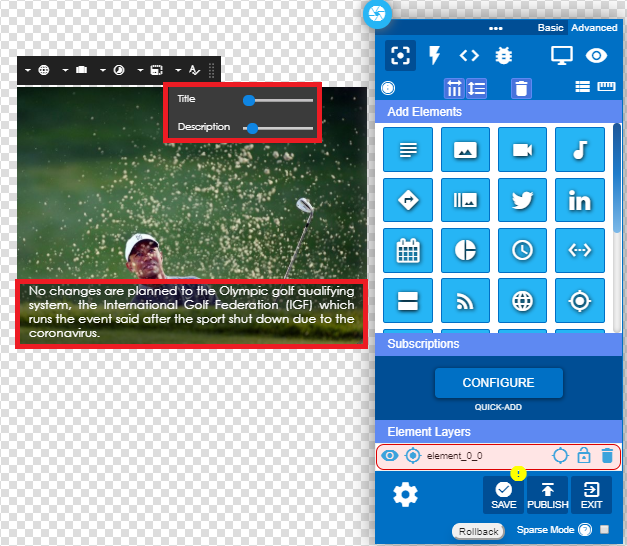
6 – Adjust the Title and Description.
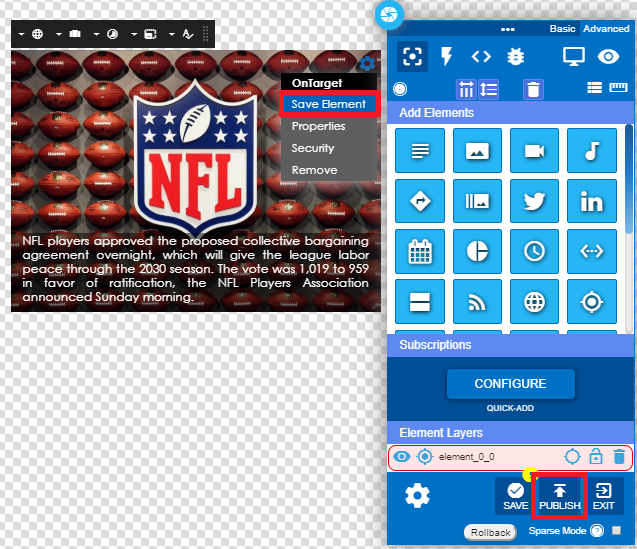
7 – Save the element and publish.
Adding OnTarget Ticker Info
1 – Click and drag the OnTarget Icon into the layout area and edit the element.
2 – Click on the drop-down arrow and select the Data option.
3 – Select Weather.
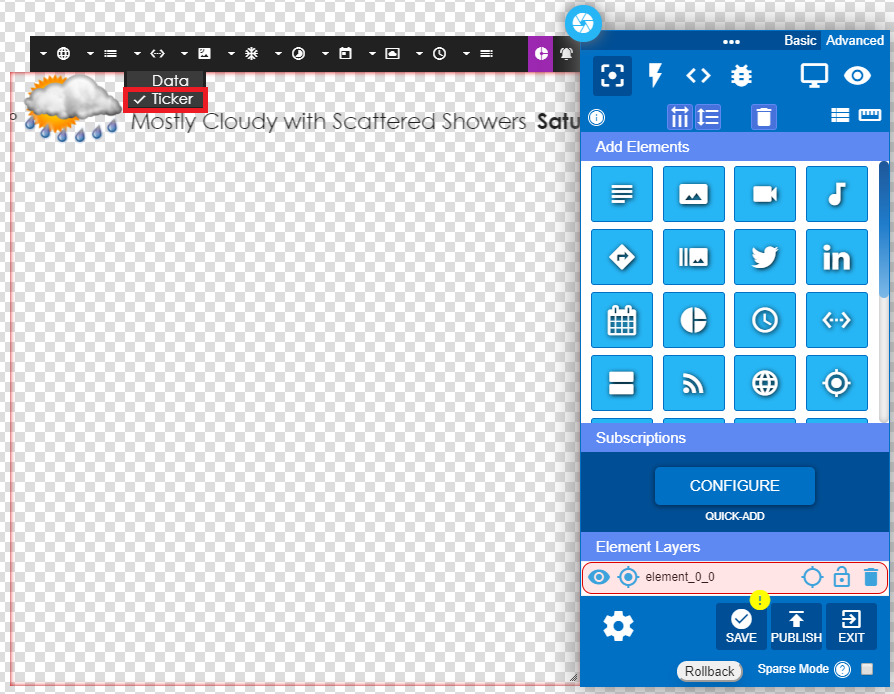
4 – Select the type of data to display – full screen data or ticker data.
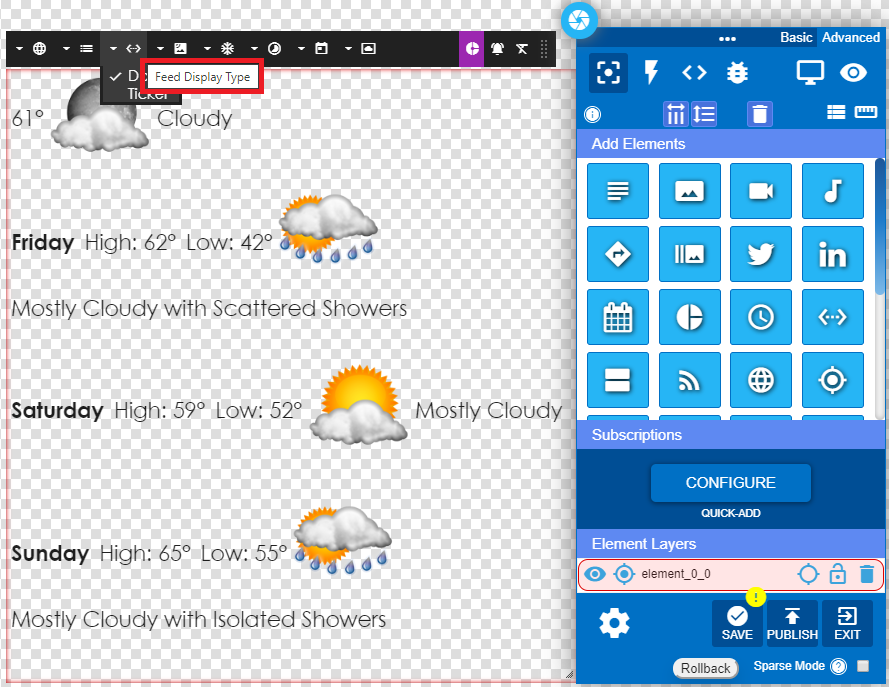
5 – Select Data for multiple rows of text and weather icons.
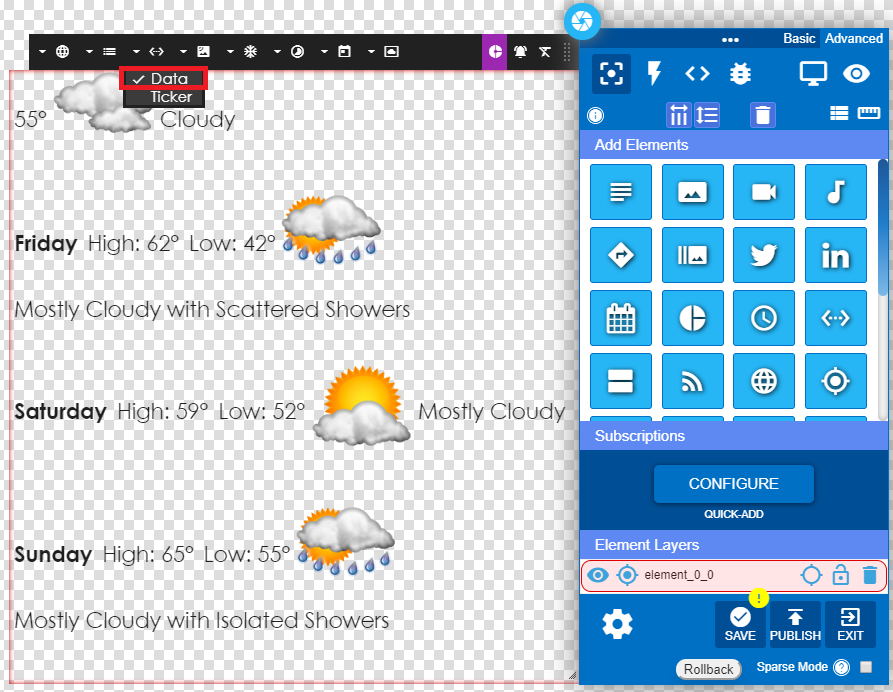
6 – Select Ticker for a single row of data and icons scrolling to the left.
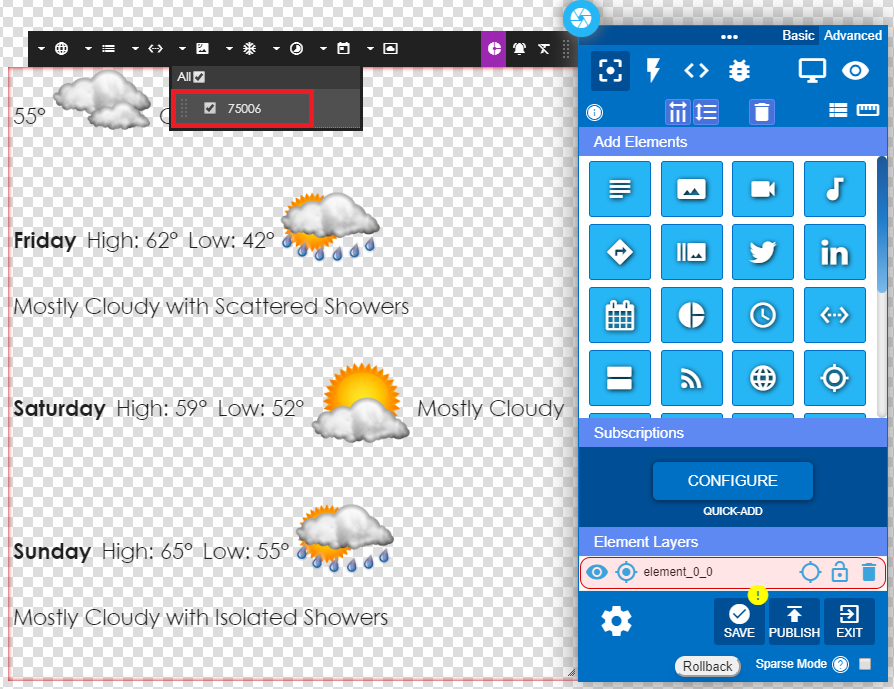
7 – Select the zip code. Weather for multiple zip codes can be generated.
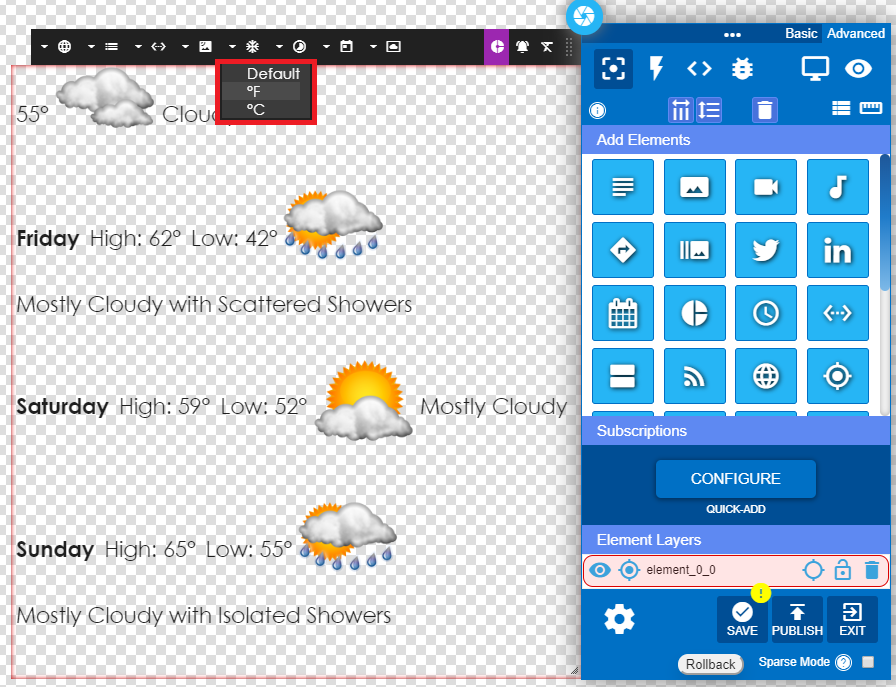
8 – Select Fahrenheit or Celsius.
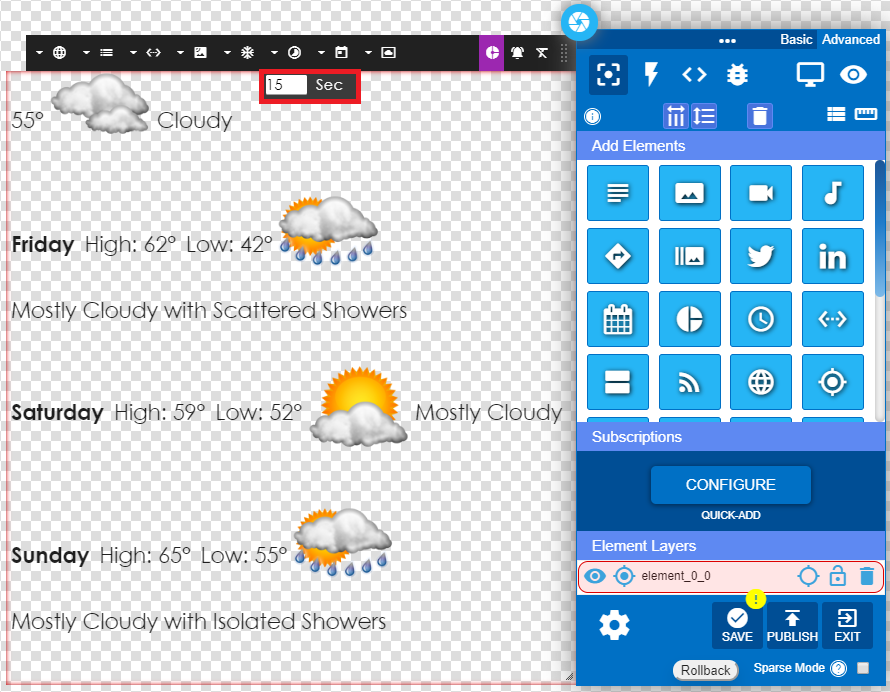
9 – Select the display time.
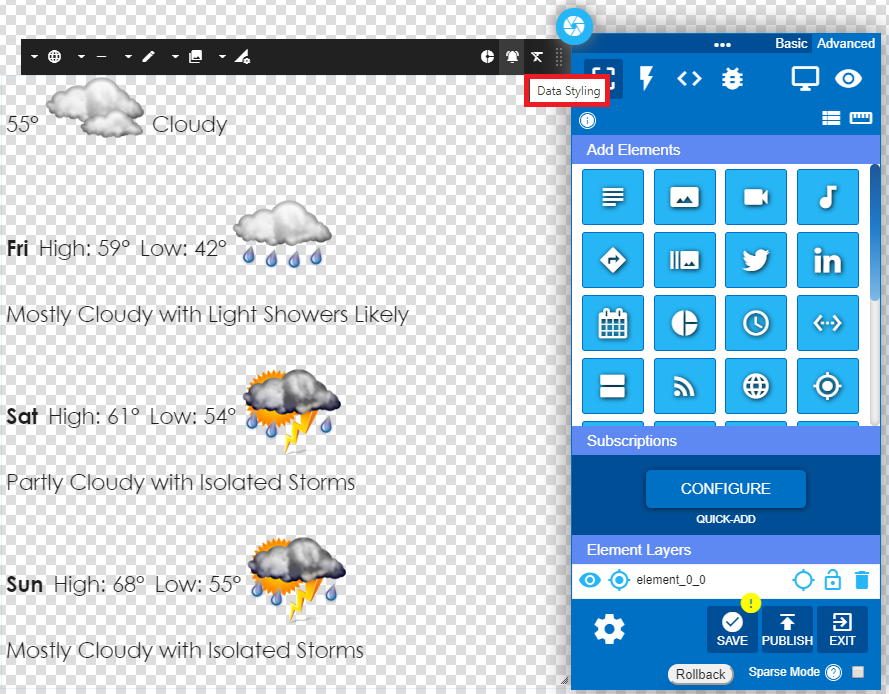
10 – Select Data Style for multiple styling choices.
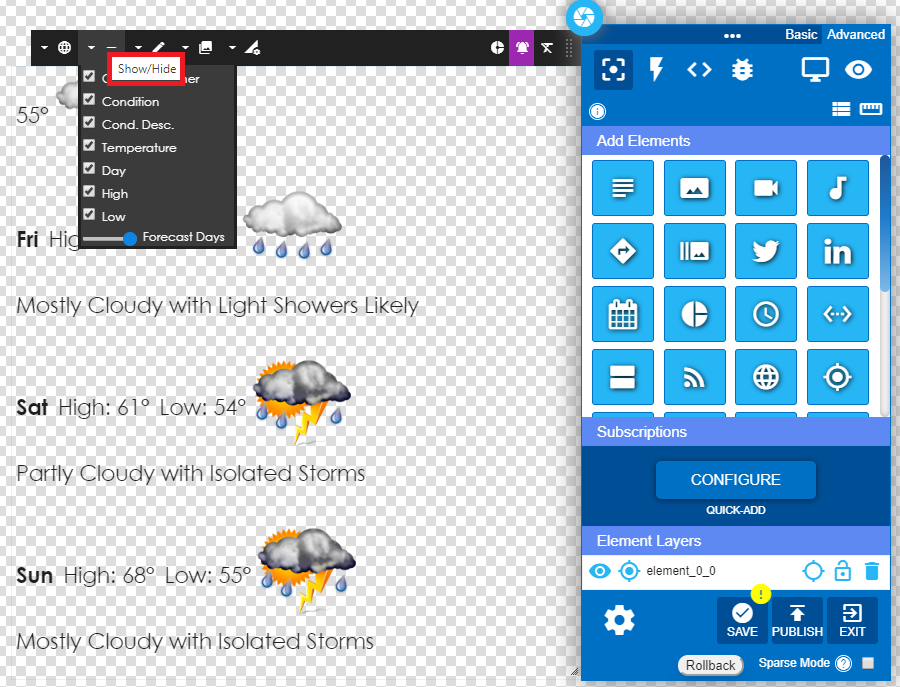
11 – Chose the data to display from the Show/Hide option.
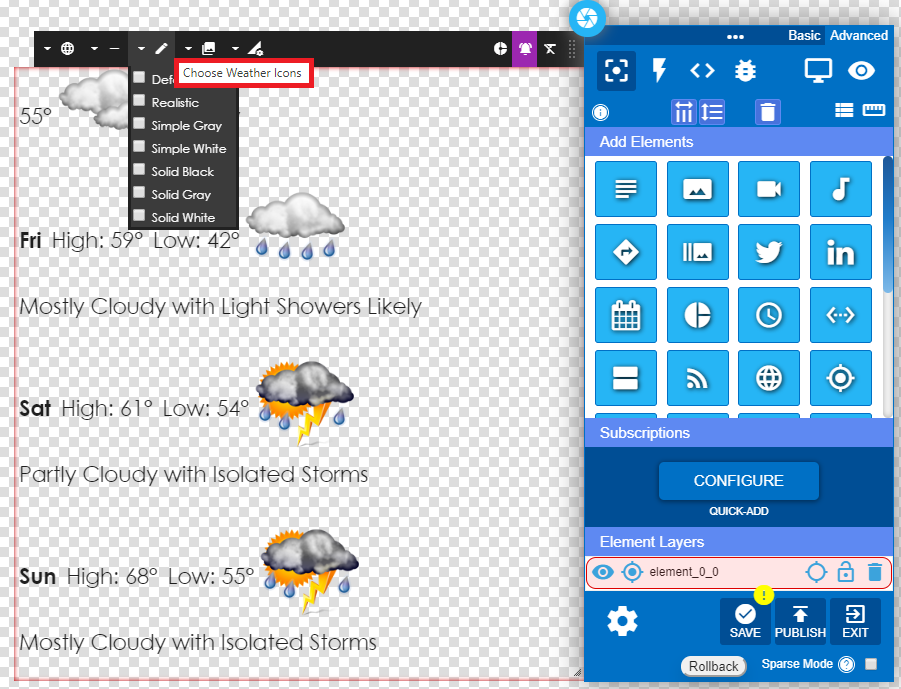
12 – Choose Weather Icons allows several options for icon style.
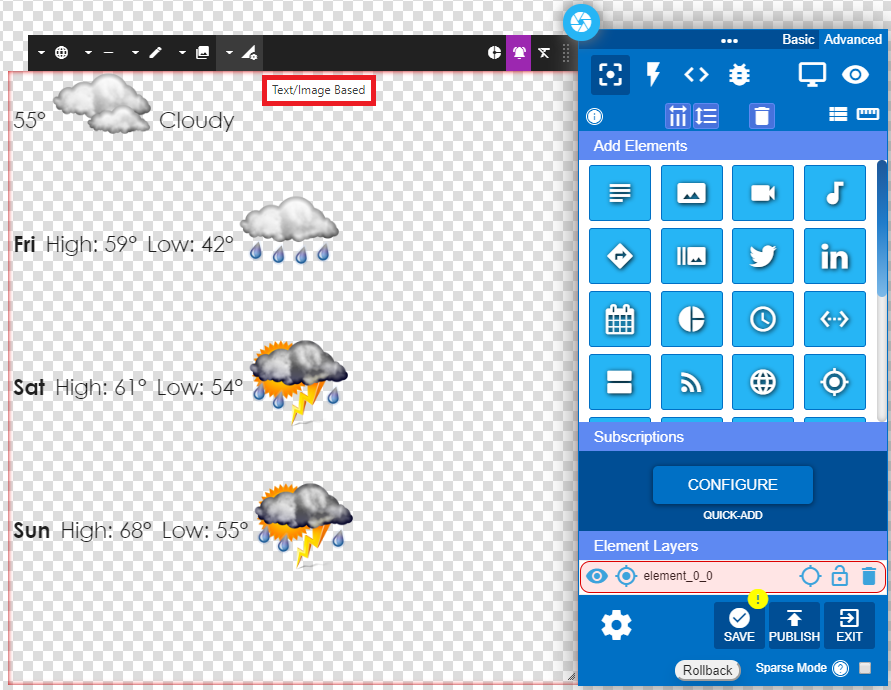
13 – From the Text/Image Based tab you can only display the data text.
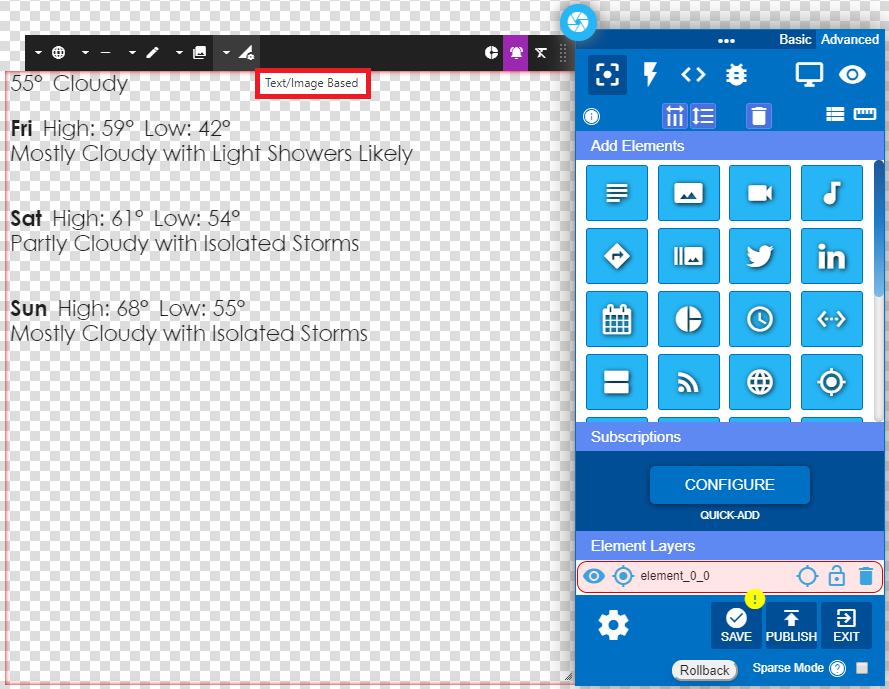
14 – From the Text/Image Based tab you can also display limited data text.
15 – Save the element and publish.